Over eighty contestants entered the competition across four continents.
We challenged students, researchers, and citizen scientists to predict the peak bloom date of cherry trees at four locations around the world: Washington D.C., USA; Kyoto, Japan; Vancouver, Canada; and Liestal-Weideli, Switzerland. While cherry trees are blooming earlier over the last four decades as the climate warms, complex weather patterns make annual prediction extremely difficult. Over eighty contestants across four continents formed forty-one teams to take up our challenge to build statistical models that produce accurate and interpretable predictions. Their work was reviewed by an independent panel of judges, and after two rounds of review, we are thrilled to announce the winners.
The results are in!
This year, five teams won awards in three categories: most accurate prediction, best model, and best narrative. The team members will share more than $5,000 in total prize money.
RStudio Award for Most Accurate Prediction goes to Sara Alhassani and D.J. Grant
Sara and D.J. submitted the most accurate forecast. Their average prediction was within three days of the actual bloom date. To create their predictions, the team collected data on the amount of air pollution in each city (specifically fine particulate matter, PM2.5 from Berkeley Earth) and combined it with temperature data from the National Oceanic and Atmospheric Administration (NOAA). Congratulations Sara and D.J.!
Award for Best Model goes to Joshua Wright and Taehoon Song
Joshua and Taehoon combined a popular statistical model (the logistic-growth model) with a popular biological predictor (growing degree days or GDD). The judges appreciated the simplicity and interpretability of this approach, with one remarking that the team provided “a wonderful demonstration of the power of using the simplest possible model that captures the key biological aspects of the question.” Another was impressed by a “model framework strongly inspired by the biology of the system, and integrated it into a relatively strong statistical framework.” Congratulations Joshua and Taehoon!

Award for Best Narrative (Biology) goes to Xinyu Zhang, Lezheng Fang, YuXin Wang, and Feng Yu
Xinyu, Lezheng, Yuxin, and Feng also combined a popular statistical model (logistic regression) with a popular biological predictor (accumulative degree days). The judges found their narrative to be clear and carefully constructed. One judge commented that it is “rare to see such a tight linkage between biology and modelling, a joy to read.” Another described it as “Nicely written, visualized and organized. Well described and reasoned” Congratulations Xinyu, Lezheng, Yuxin, and Feng!

Award for Best Narrative (Statistics) goes to Miaoshiqi Liu and Siyue Yang
Miaoshiqi and Siyue used machine learning (a varying-coefficient regression model) to capture how the relationship between peak bloom date and the predictors may change over time. The judges were impressed by the clever application of semi-supervised learning to predict the Vancouver bloom date and their beautiful visualizations. One judge commented that their work was “an intelligible and intelligent narrative that outlines not just how methods were applied but also why they were appropriate.” Congratulations Miaoshiqi and Siyue!
Award for Best Narrative (Undergraduate) goes to Leung Hoi Kit Alvin and Aaron Lee Wei Qi
Leung and Aaron applied a popular time series approach (autoregressive integrated moving average model) to make their predictions. The judges noted the team considered the assumptions underlying the model and introduced adjustments to make their analysis more realistic. They also appreciated the succinct but complete and coherent narrative the team provided. Congratulations Leung and Aaron!

An honorable mention goes to Matt Harding
Matt collected a large amount of temperature data and applied a popular statistical learning algorithm (elastic net regularized regression) to make his predictions. He also used his personal experience planning around the D.C. Cherry Blossom festival to engage the reader and introduce the prediction problem. One judge loved how Matt invited “the reader into the scientist’s thought process in tackling a difficult problem with no one ‘right’ or ‘obvious’ solution.” Congratulations Matt!
A big thanks to all our participants
We know every contestant worked hard to produce their most accurate and interpretable predictions. All their work will help scientists better understand the impacts of climate change, and we hope their contribution does not end here. We encourage each contestant to continue to work on their models and narratives and reenter the Cherry Blossom Prediction Competition again next year.
Contestants vary widely in their predictions for 2022.
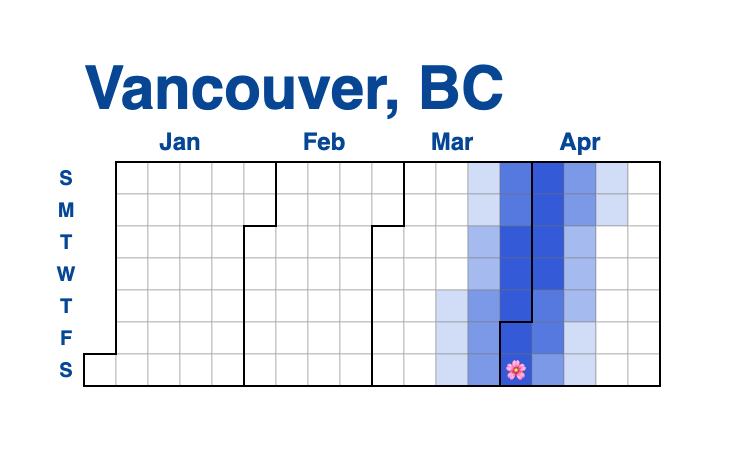
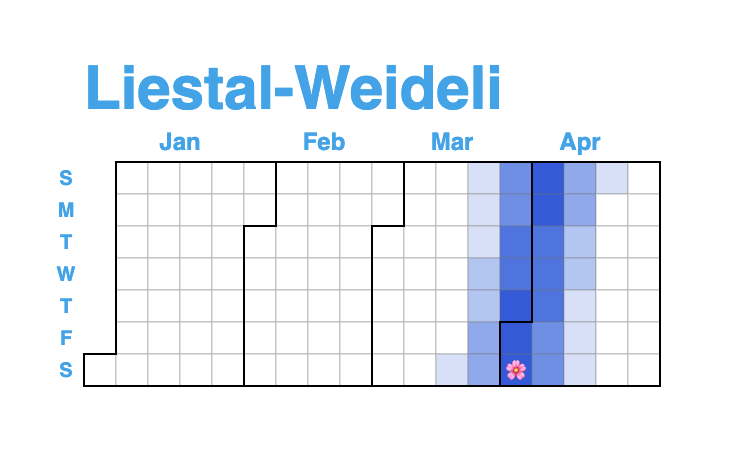
Some anticipate a peak bloom date as early as March 1st and others as late as May 8th. When the entries are combined, the overall consensus is that the cherry trees will likely bloom between late March and early April. (The average predicted peak bloom dates are April 3rd for Kyoto, April 2nd for Liestal-Weideli and Vancouver, and April 1st for Washington D.C.—denoted on the calendars below by 🌸)
These calendars show which days the contestants predicted the peak bloom date will occur.
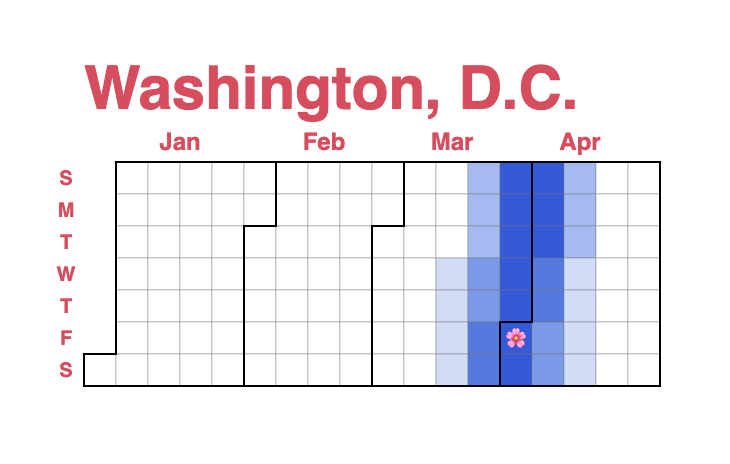

Overall, the contestants believed the National Park Service prediction was too early.
The National Park Service predicted the peak bloom of the Washington D.C. cherry trees will be between March 22nd and March 25th. The Washington Post predicted a similar range, between March 22nd and March 26th. Several contestants agree with this prediction. But overall, the contestants anticipate these dates were too early. The entries suggest only a twenty percent chance the peak bloom will occur on March 26th or earlier. The contestants preferred the four-day window a week later, between March 30th and April 2nd.
In contrast, the contestants largely agreed with the Japan Meteorological Corporation’s 5th forecast, which predicted that the peak bloom of the Kyoto cherry trees will occur on April 6th.
For Vancouver, B.C, where there is almost no historical data, contestants thought that full bloom will be on April 2nd. The Vancouver Cherry Blossom Festival posts updates on the stage of their cherry trees on the UBC Botanical Garden Forums.
Another big thanks to our sponsors, partners, and judges.
A big thanks to RStudio, the American Statistical Association, Caucus for Women in Statistics, George Mason University’s Department of Statistics, and Columbia University’s Department of Statistics for their support, and partnerships with the International Society of Biometeorology, MeteoSwiss, USA National Phenology Network, and the Vancouver Cherry Blossom Festival—as well as Mason’s Institute for Digital InnovAtion, Institute for a Sustainable Earth, and the Department of Modern and Classical Languages. We also thank our judges Lelys Bravo de Guenni, Cheryl Brooks, Rebecca Forkner, Mason Heberling, Will Pearse, Eric Post, Richard Primack, Christine Rollinson, and Ed Wu. Thank you!
Forest Ecologist
The Morton Arboretum

Associate Professor of Biology
George Mason University

Professor of Biology
Boston University

Senior Lecturer
Imperial College London
Statistics Research Department
AT&T Labs
Assistant Curator of Botany
Carnegie Museum of Natural History
Visiting Associate Professor
Department of Statistics
University of Illinois at Urbana-Champaign
Director, The Polar Forum & The APPLES Project
Professor of Climate Change Ecology, University of California, Davis
Science Policy Fellow
American Statistical Association
Organizers
Jonathan Auerbach
Department of Statistics
George Mason University
https://jauerbach.github.io/
David Kepplinger
Department of Statistics
George Mason University
https://www.dkepplinger.org
Elizabeth Wolkovich
Department of Forest & Conservation Sciences
University of British Columbia
https://temporalecology.org/
Sponsors
Partners