2026 Cherry Blossom Prediction
We challenged contestants to predict the day that the cherry trees will reach peak bloom.
We asked contestants to submit their best predictions for select trees in Washington, D.C. and New York City (USA), Kyoto (Japan), Liestal-Weideli (Switzerland), and Vancouver, B.C. (Canada), along with a compelling narrative and reproducible analysis containing any data and code used. The competition is challenging because while it is known that cherry trees tend to bloom earlier as climates warm, complex weather patterns make annual predictions extremely difficult.
For the fifth year in a row, students, researchers, and citizen scientists from around the world accepted our challenge. We will not be able to declare a winner until the cherry trees bloom later this year, but we are excited to share the predictions made by the contestants.
The predictions are in!
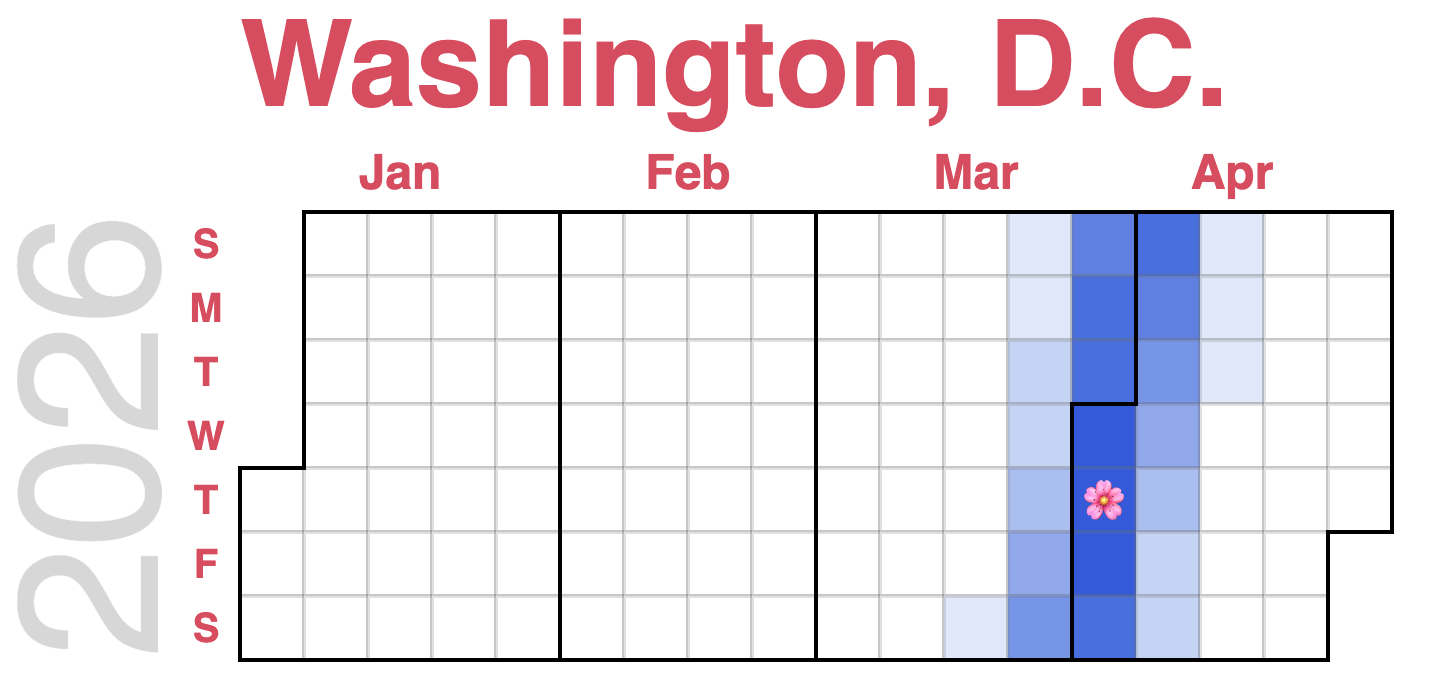
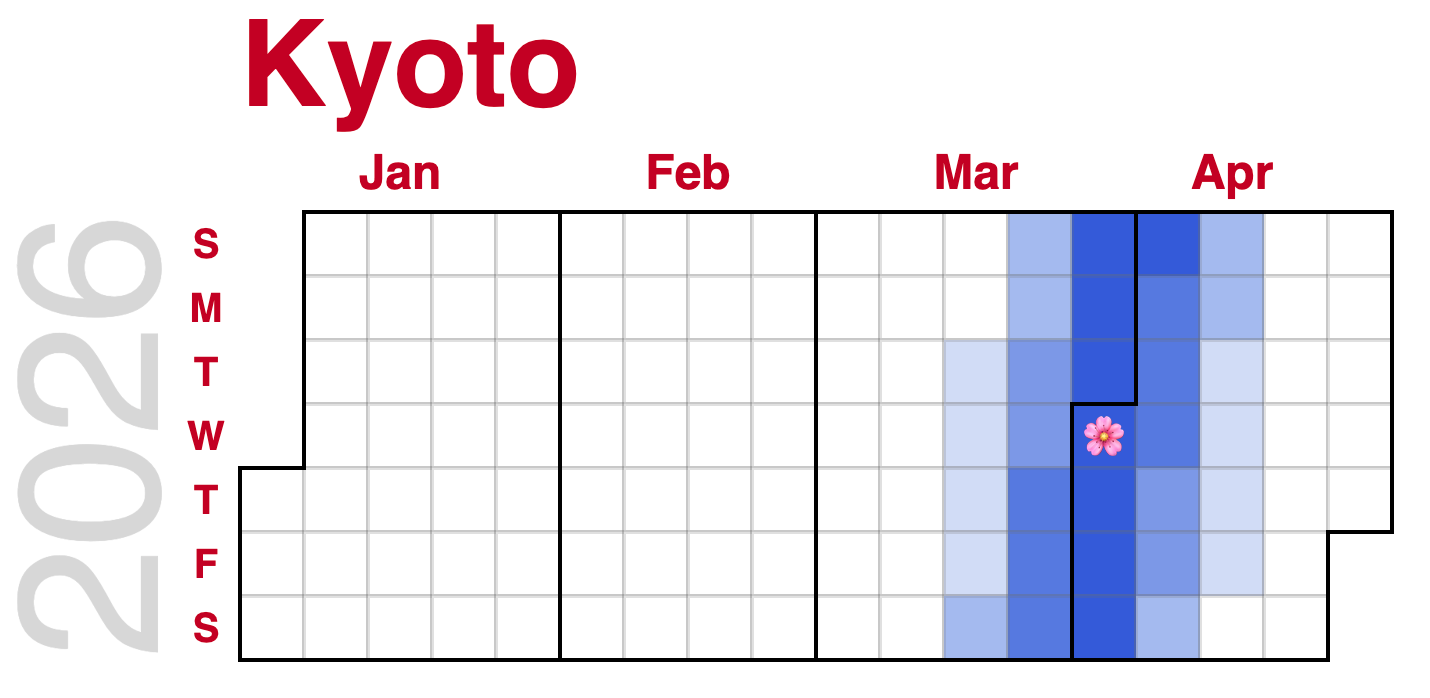
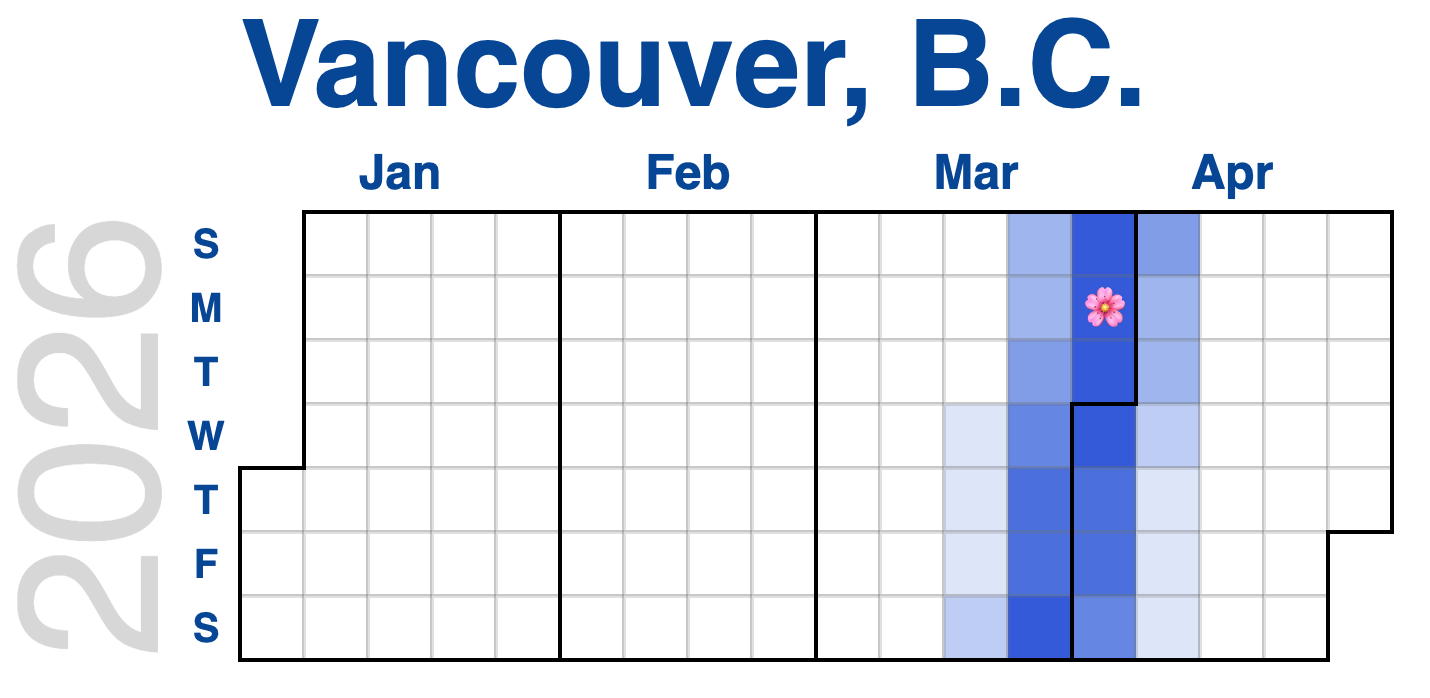
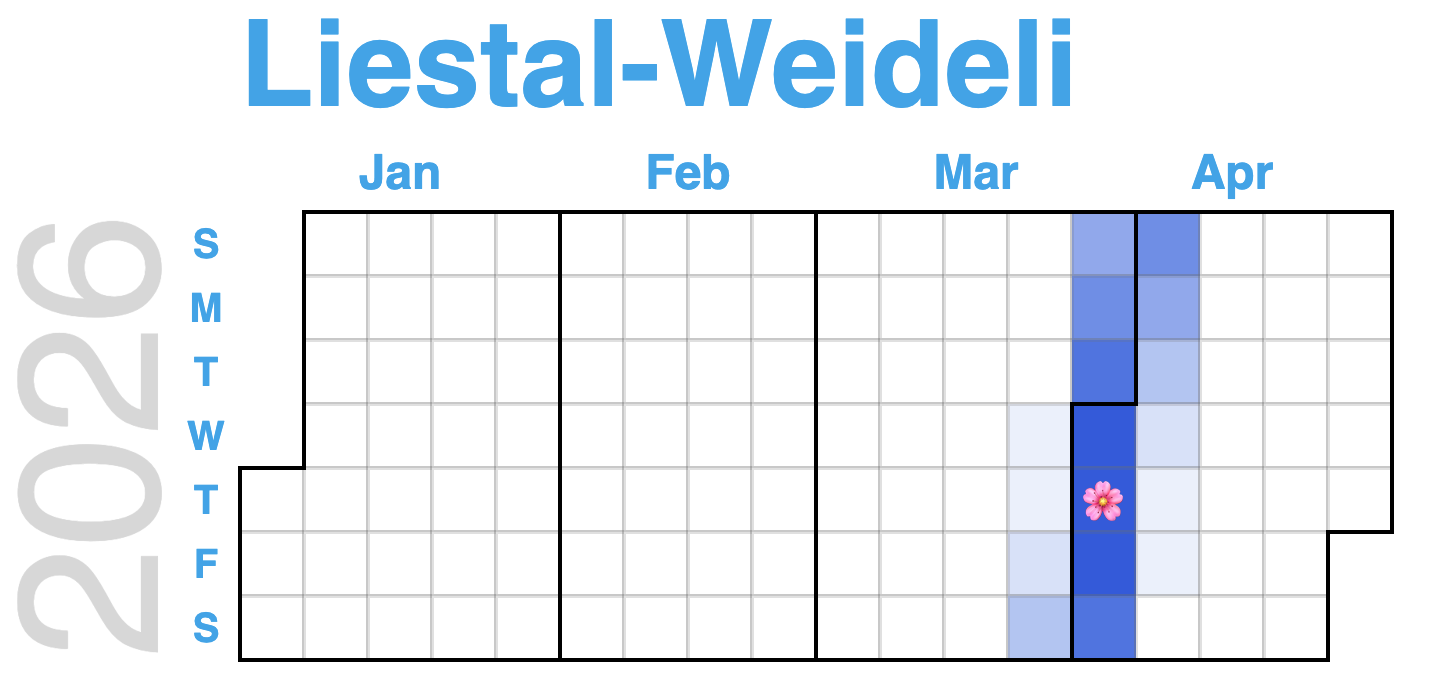
The calendars below show the days the contestants predict the peak bloom date will occur. Some believe peak bloom will occur in early March, while others believe it will occur in early May. When the entries are combined, the consensus is that the cherry trees will reach peak bloom between late March and early April. The average predicted peak bloom dates are March 30th for Vancouver, BC, April 1st for Kyoto, April 2nd for Washington D.C. and Liestal-Weideli, and April 6th for New York City—denoted on the calendars by 🌸.

Overall, the contestants agree with the Japan Meteorological Corporation prediction
The contestants agree with the Japan Meteorological Corporation’s 6th forecast on average, which predicts that the peak bloom of the Kyoto cherry trees will occur on March 31st. (Note JMC provided predictions for Prunus × yedoensis while the contestants predicted Prunus jamasakura. These species have similar but not identical bloom dates.)
The National Park Service predicts the peak bloom of the Washington D.C. cherry trees will occur between March 29th and April 1st. The entries from the contestants suggest a similar range (March 31st to April 4th). This also overlaps with the predictions from Storm Team4 (March 30th to April 5th) and The Washington Post (April 3rd to April 7th).
For Vancouver, BC and New York City, where there is almost no historical data, contestants thought that full bloom would be March 30th and April 6th, respectively. The Vancouver Cherry Blossom Festival posts updates on the stage of their cherry trees on the UBC Botanical Garden Forums.
A big thanks to our sponsors, partners, and judges.
We thank Posit, American Statistical Association, Washington Statistical Society, Caucus for Women in Statistics, George Mason University’s Department of Statistics, Georgetown University’s Massive Data Institute, and Columbia University’s Department of Statistics and Real World Data Science for their support, and partnerships with the International Society of Biometeorology, MeteoSwiss, USA National Phenology Network, the Vancouver Cherry Blossom Festival, Local Nature Lab, and WSP Eco Projects—as well as Mason’s Institute for Digital InnovAtion, Institute for a Sustainable Earth, and the Department of Modern and Classical Languages. We also thank our observers who send in observations of flowering, and our judges Lelys Bravo de Guenni, Brittany Sutherland, Mason Heberling, Nathan Lenssen, Will Pearse, and Christine Rollinson. Thank you!
Organizers
Jonathan Auerbach
Department of Statistics
George Mason University
https://jauerbach.github.io/
David Kepplinger
Department of Statistics
George Mason University
https://www.dkepplinger.org
Elizabeth Wolkovich
Department of Forest & Conservation Sciences
University of British Columbia
https://temporalecology.org/
Judges
Forest Ecologist
The Morton Arboretum
Clinical Associate Professor
Department of Statistics
University of Illinois at Urbana-Champaign

Teaching Assistant Professor, Dept. of Applied Mathematics and Statistics
Colorado School of Mines

Senior Lecturer
Imperial College London

Assistant Professor of Biology
George Mason University
Assistant Curator of Botany
Carnegie Museum of Natural History